LUNA will automatically calculate midpoints for all of your displayed chart points. You can view the midpoints for a chart by opening the Midpoint DataSheet.
Show Midpoints on Charts
In addition to calculating midpoint values, LUNA can also display midpoints directly on chart wheels. You can select which ones you want to display:
- Login to your account if you’re not already logged in.
- [Desktop] Select your name from the upper-right of the screen or…
- [Mobile] Select the “more” link (3 dots) from the upper-right of the screen.
- A menu will display with a “Settings” link.
- Select that link to access your personal preferences.
- Select the “Midpoints” tab.

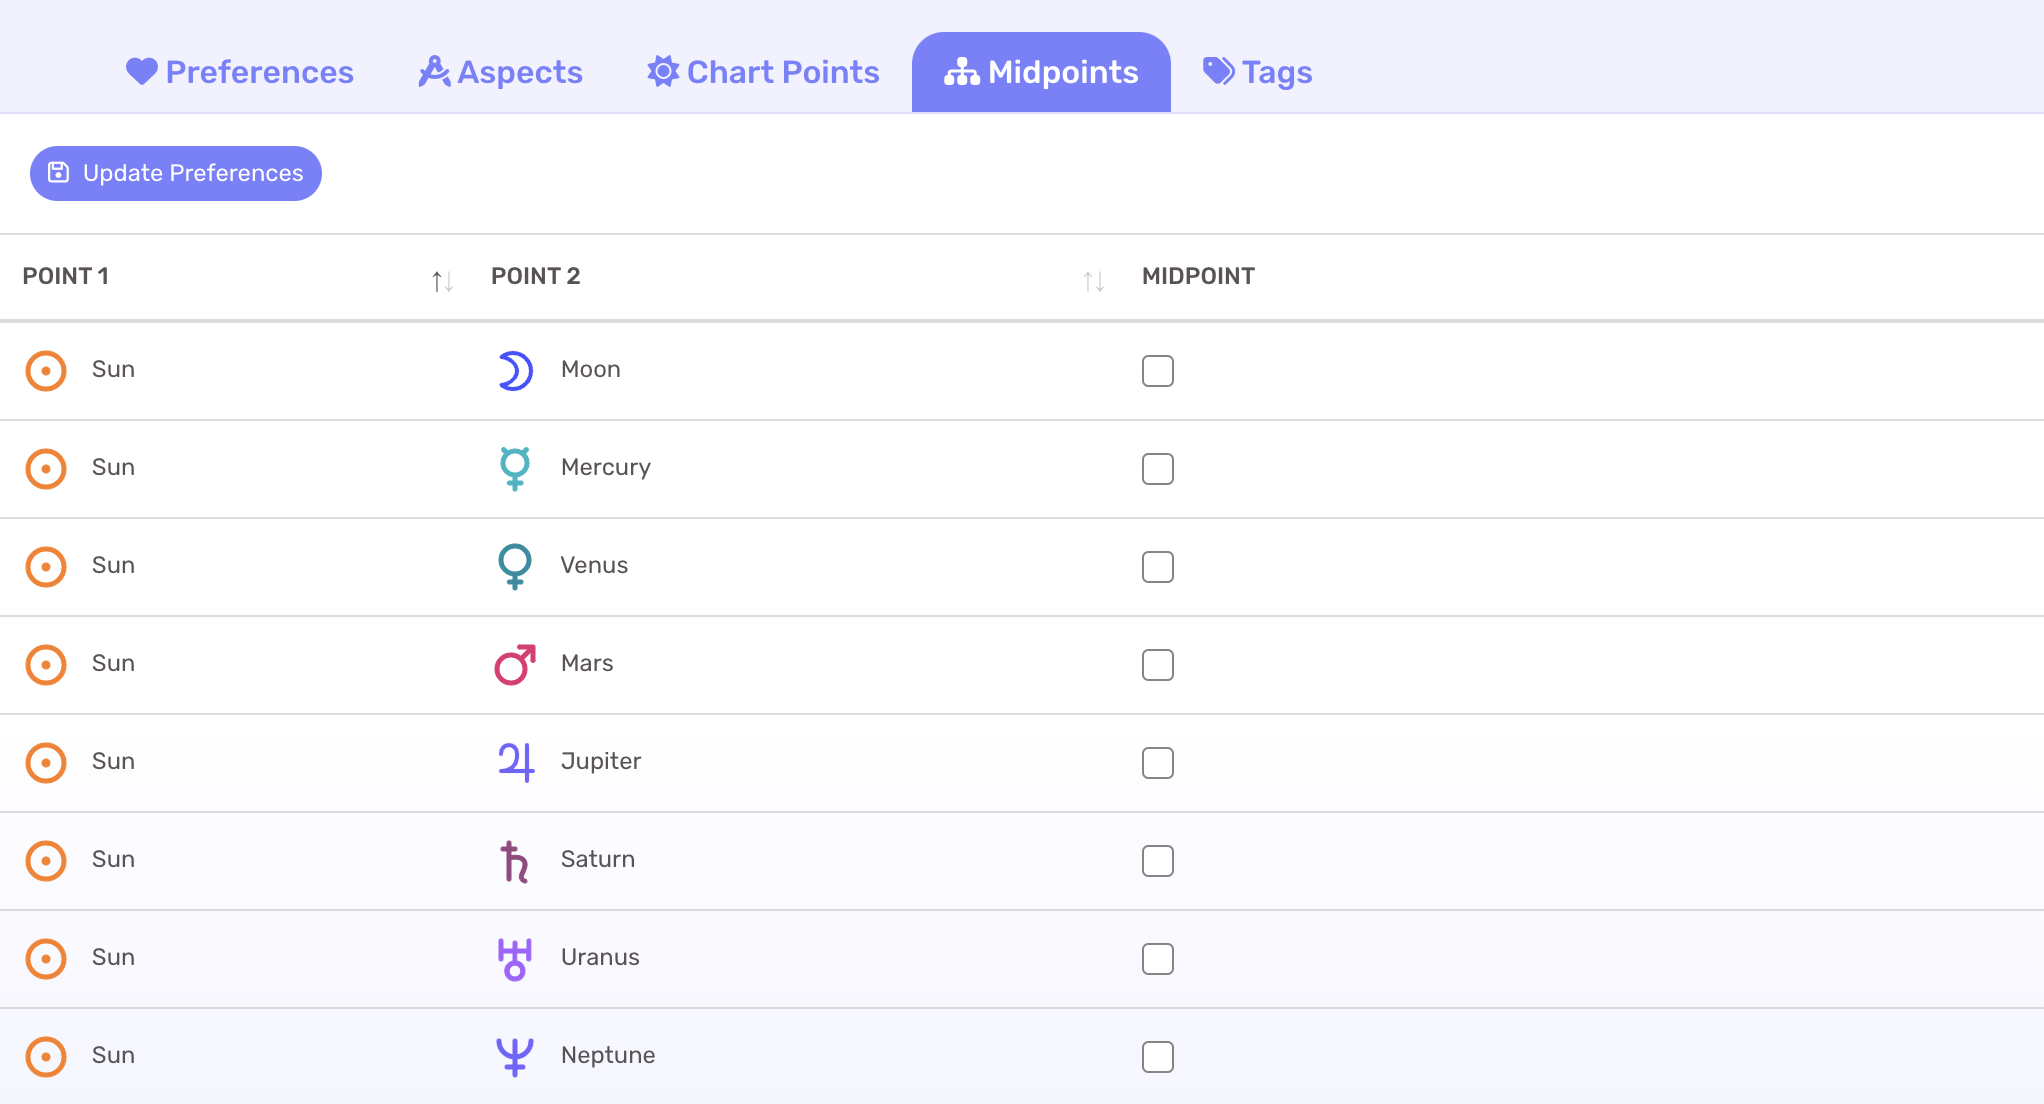
All possible midpoints between your displayed chart points will show on this screen. You can select any number of midpoints and LUNA will display them on your charts.
When you are finished, select “Update Preferences” to save your changes.
Example Chart

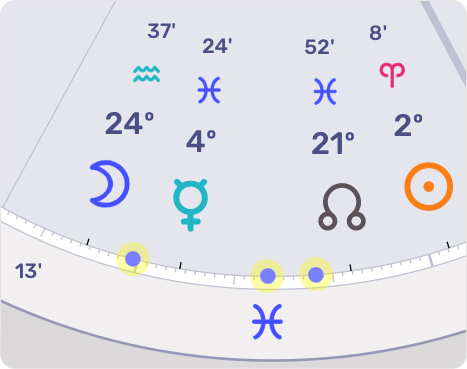
This is an example showing the Sun-Moon, Sun-Mercury and Moon-Mercury midpoint on a chart.
