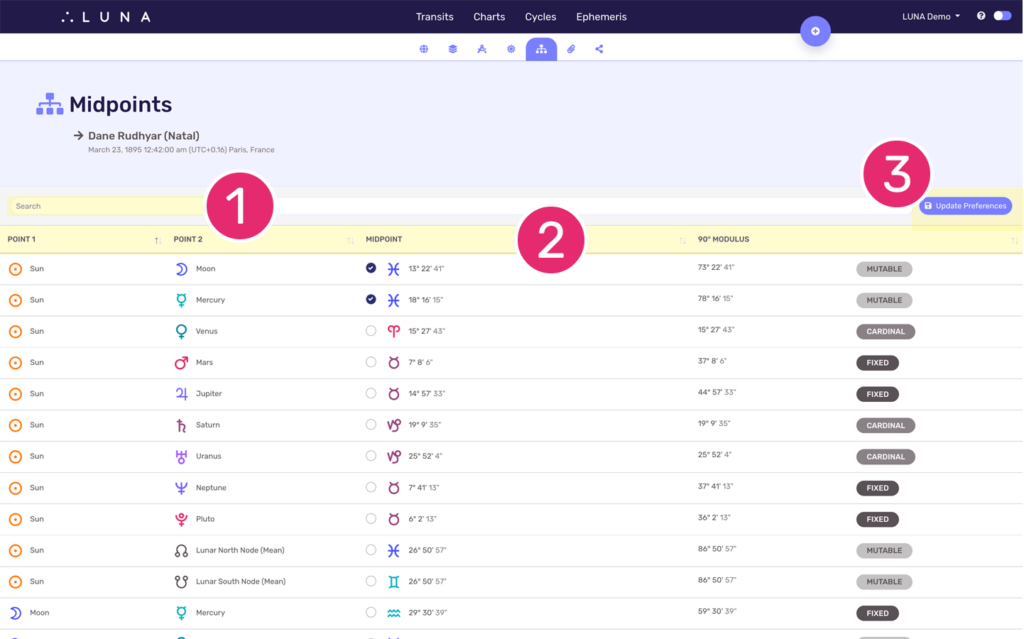
The Midpoints DataSheet provides a list of all calculated midpoints based on the chart points enabled in your settings.

Select this icon from the toolbar to view the Midpoints DataSheet for the current chart.
The midpoints list is in planetary order with each row containing a planetary pair. The following information for each midpoint pairing is available:
- Zodiacal sign & position (ecliptic longitude) of the midpoint
- The 90º modulus variant of the midpoint
- The qualitative location of the midpoint based on the sign
Uniwheel Charts
When looking at a single chart of any type, you’ll see a screen like the one below which shows you all midpoints in planetary order based on the chart points you have enabled in your settings.

1. Search Midpoints
This list is searchable which means you can enter any keyword into the search box and only the matching results will show. For example, if you enter “jupiter” as a search term, only midpoints with Jupiter as one of the two (2) points will display.
2. Sort Midpoints
Another way to look through this list of midpoints is by sorting them by any of the column headers. Notice there is a double arrow icon to the right of each column header. This icon can be clicked or tapped to sort the list by that factor. Select the icon again to sort the list in reverse order.
3. Show & Hide Midpoints
This DataSheet allows you to make changes to your settings by enabling any number of midpoints for display on your charts. Midpoints you have selected to display on your charts will have a checkmark next to them.
To add other midpoints to your charts, select the ones you want to add and then click or tap the “Update Preferences” button.

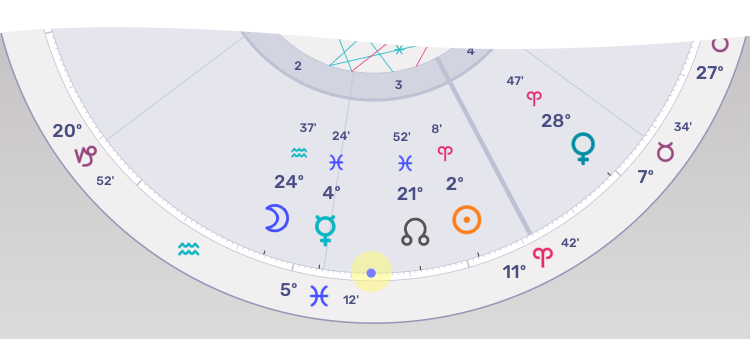
This is what a midpoint looks like on your charts. You can click or tap the midpoint “dot” to see more information.
Biwheel Charts
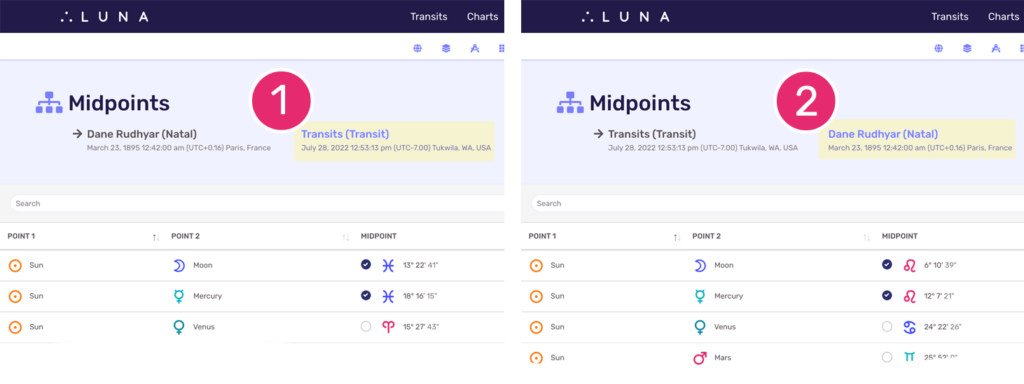
When viewing a biwheel between any two (2) charts, the Midpoints DataSheet lets you select the chart for which you want to view midpoints.

1. Midpoints for Inner Chart Wheel
The screen on the left is showing the midpoints for Dane Rudhyar. You can see this because there is an arrow pointing to his name. Additionally, the other chart title in the layout is clickable/tappable, whereas his is not.
2. Midpoints for Outer Chart Wheel
The screen on the right is showing the midpoints for the transits. You can see this because there is an arrow pointing to that chart’s title. Additionally, Dane Rudhyar’s chart title is clickable/tappable, whereas the transit chart is not.
